
Spatial Data Infrastructure
Developing an OGC-Compliant SDI for Identifying Urban Heat Stress
What is the project goal?
The goal is to support climate-responsive planning by creating a spatial data infrastructure (SDI) for urban planners, that highlights vulnerable areas affected by heat stress as well as local parameters contributing to heat stress or mitigating it.
The SDI provides users not only with a data viewer but offers access to datasets via OGC-services such as WMS as well as access to OGC compliant metadata.
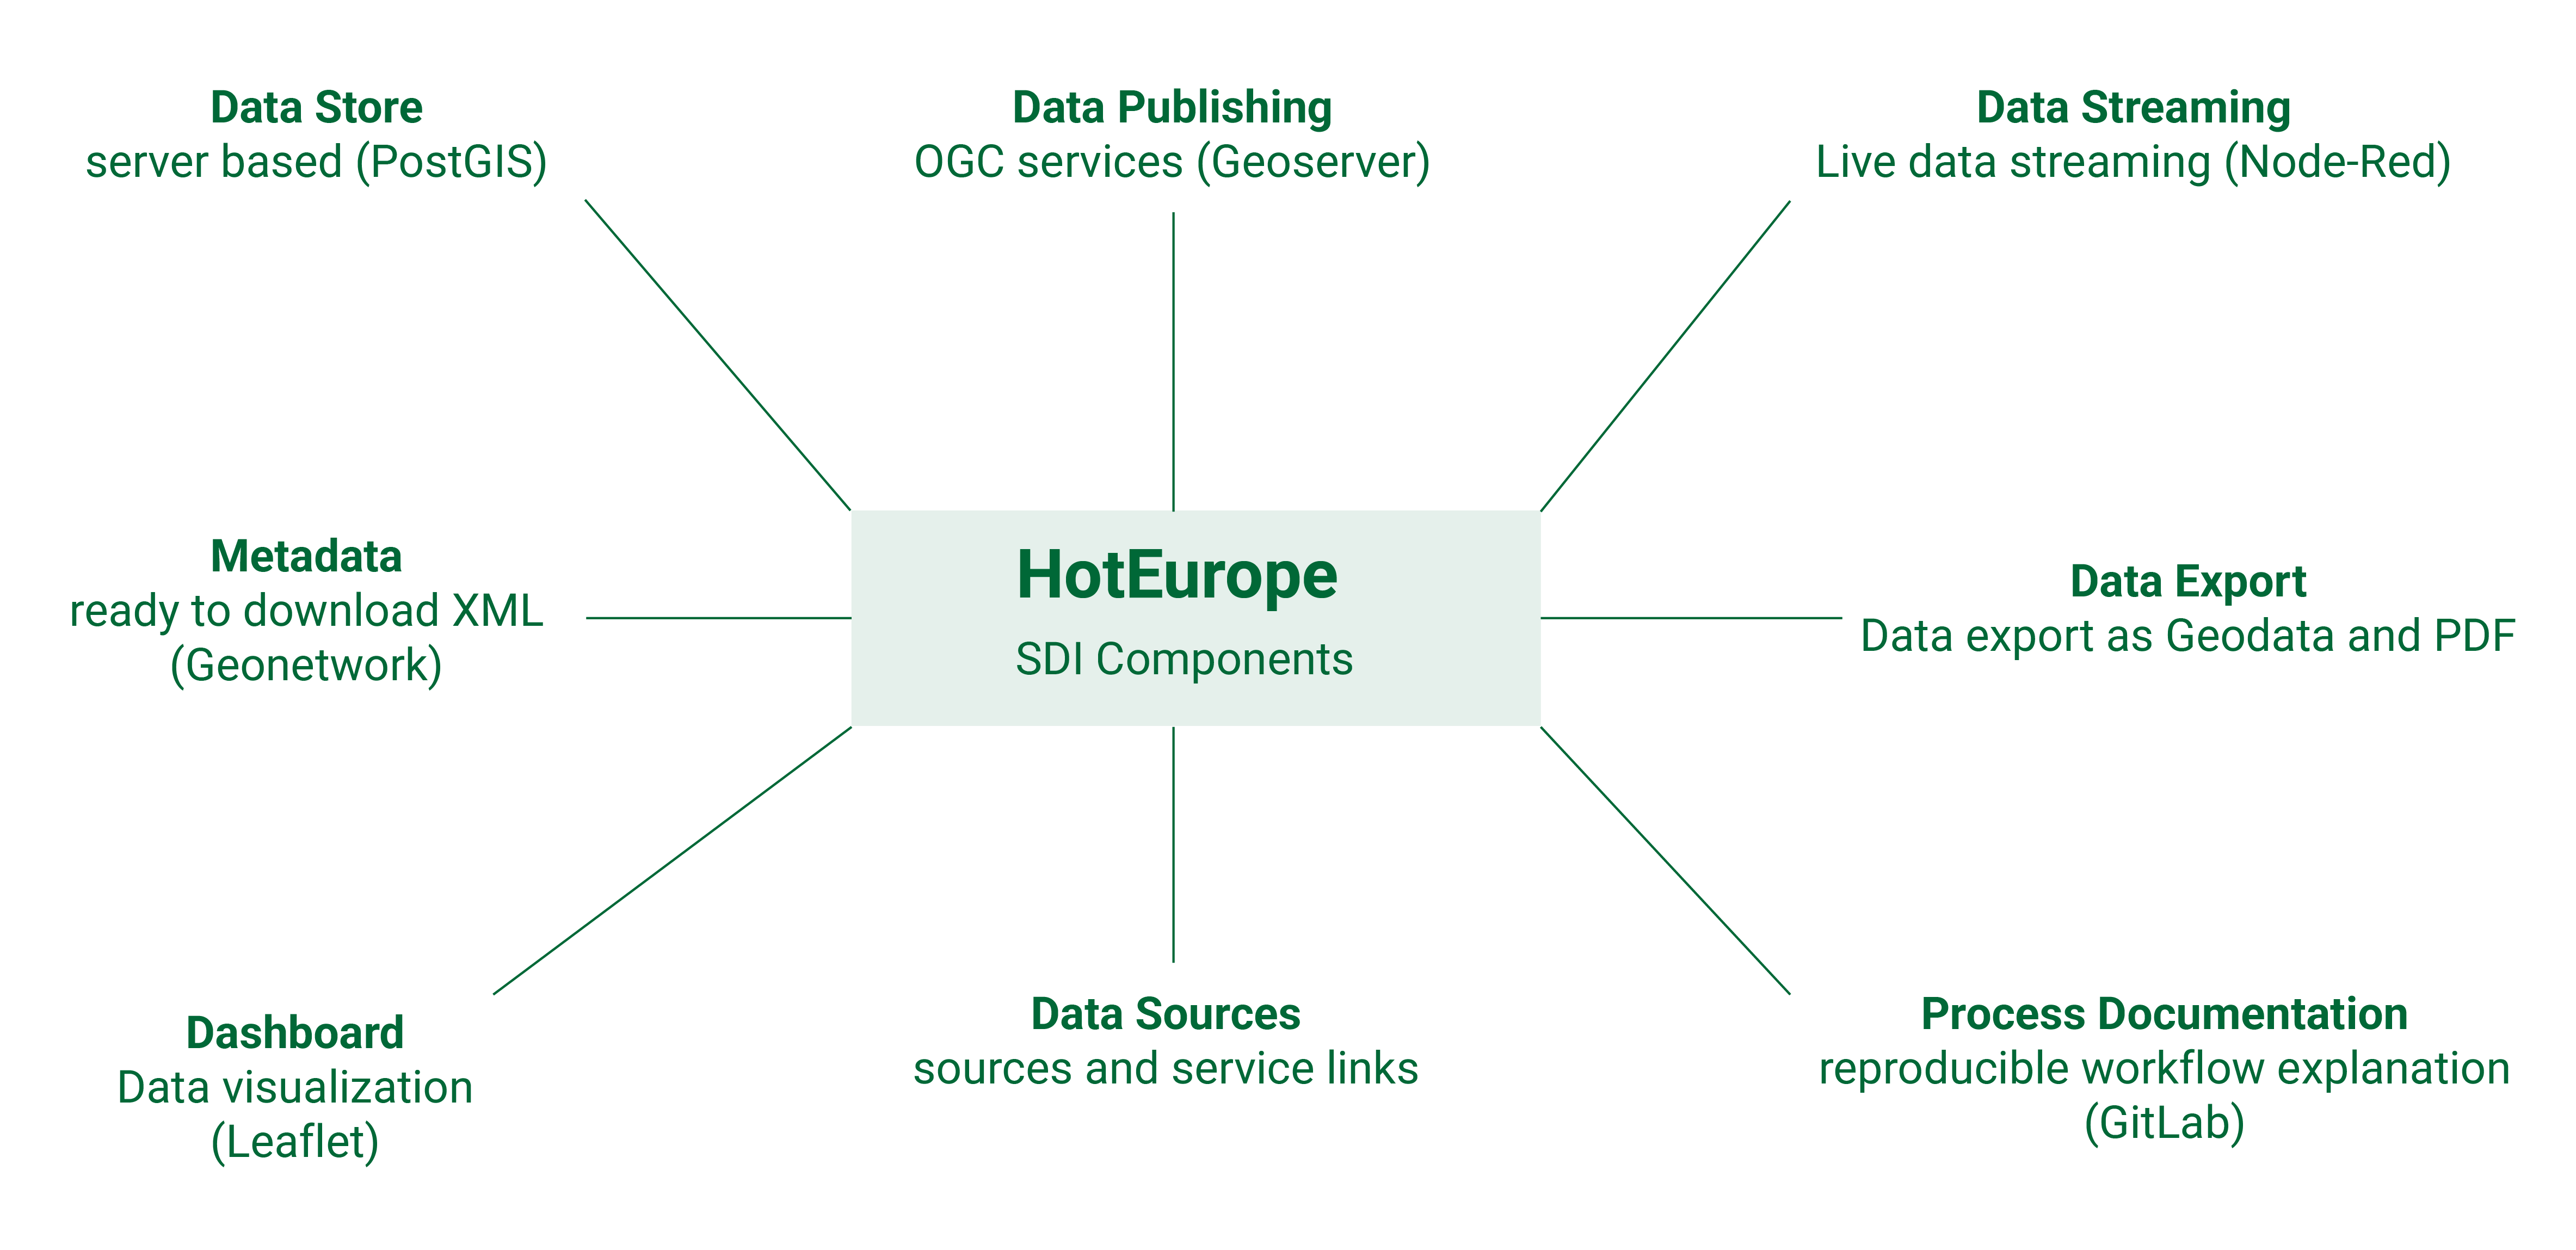
Components of the Spatial Data Infrastructure (Own Figure)
Why do we need data on urban heat?
The ongoing trend of urbanization is accompanied by significant changes in the physical properties of the land surface. Natural surfaces are replaced by impervious materials which have a lower albedo and higher heat storage capacity. Therefore, urban areas experience elevated temperatures compared to their rural surroundings. The human induced transformation of land surfaces as well as global warming are the main drivers of so-called urban heat islands. It is up to urban planners to address these challenges and create climate resilient cities.
Which data is created and integrated in the SDI?
Satellite data from Landsat 8 is used to calculate land surface temperature and locate urban heat islands (UHI). By overlaying the UHI with layers representing impervious surfaces and land use and land cover (LULC) the SDI helps understanding the underlying causes of heat stress. Layers indicating presence of green infrastructure, biodiversity and street trees, show how heat stress can be mitigated.
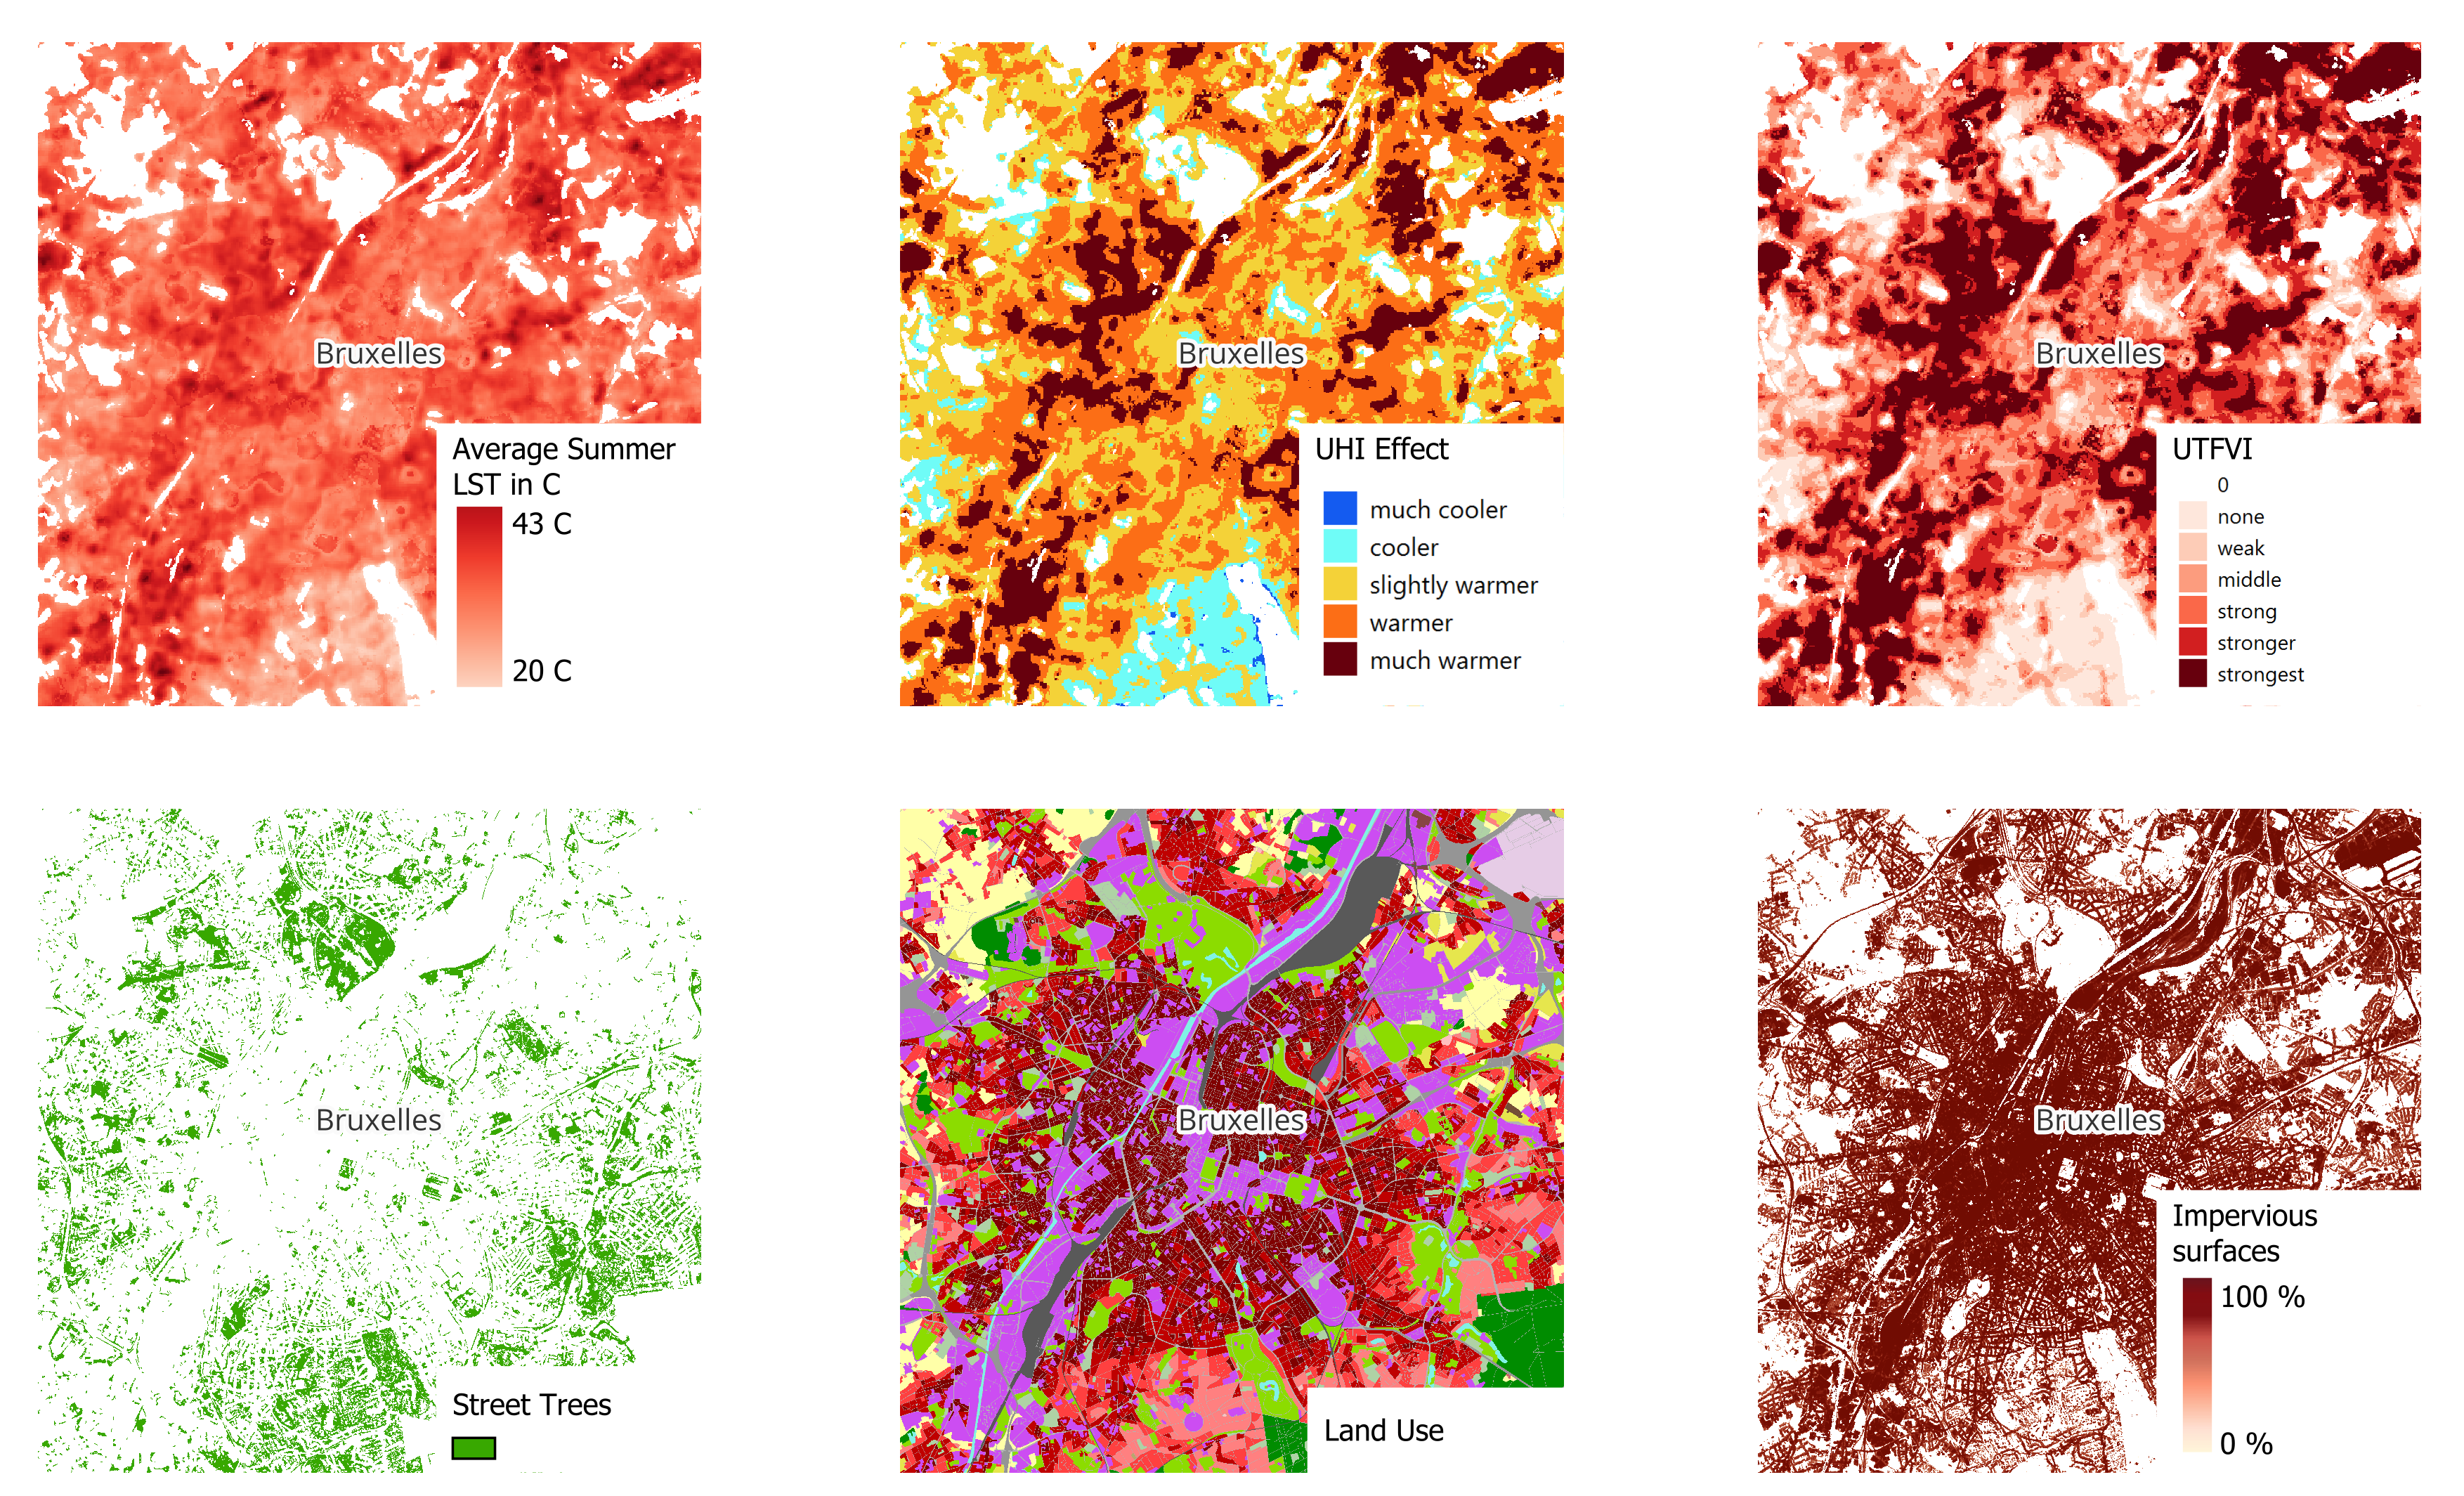
Multiple Layers for Analysing Urban Heat (Own Figure)
How is the data published and integrated?
All resulting layers are published as OGC services. The vector layers are published as WFS while the raster layers are published as WMS. For this, GeoServer is used in the workflow as shown below.
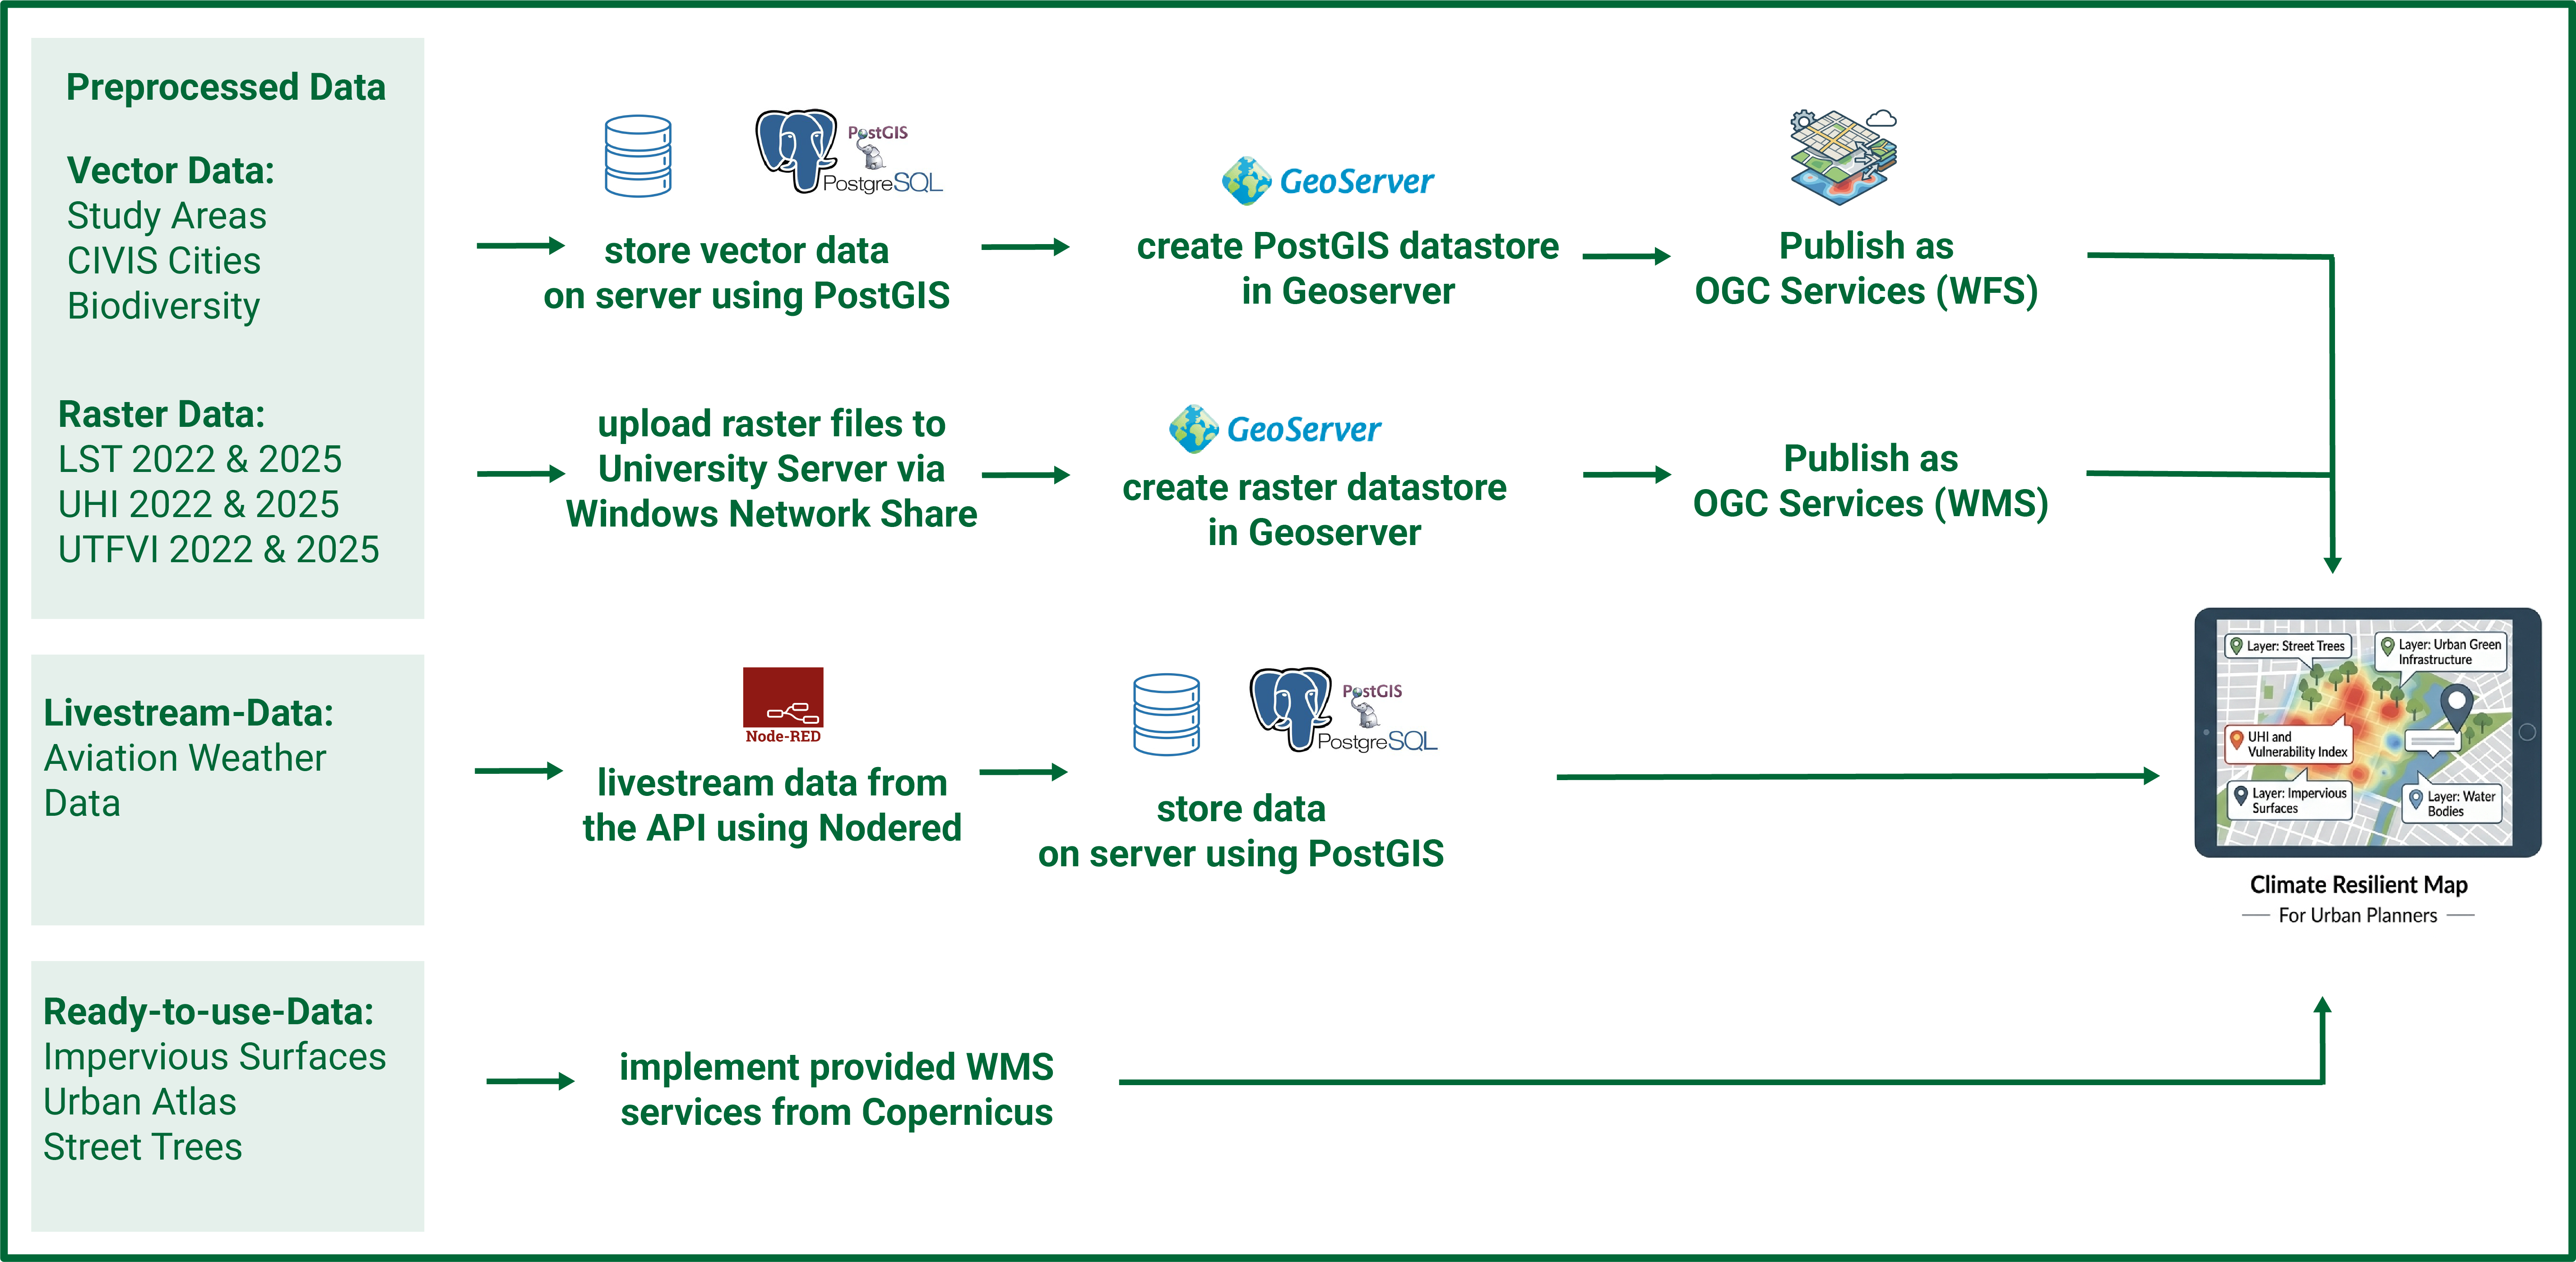
Workflow for Publishing Datasets (Own Figure)
Finally, all components of the SDI, including data sets, OGC-services, metadata etc. are integrated in a dashboard. The video gives insights into the user interface.
Video of the resulting Dashboard User Interface